Set individual time period and duration for one view
- This guide provides you explanations about Report time selection.
Procedure
- In My Swisscom Business, please select the Enterprise Connect Dashboard application.
- With Start with an Agreement, select the corresponding agreement.
- Enter the world of statistics via Service Performance Reporting.
- the values can always be set using the following icon:
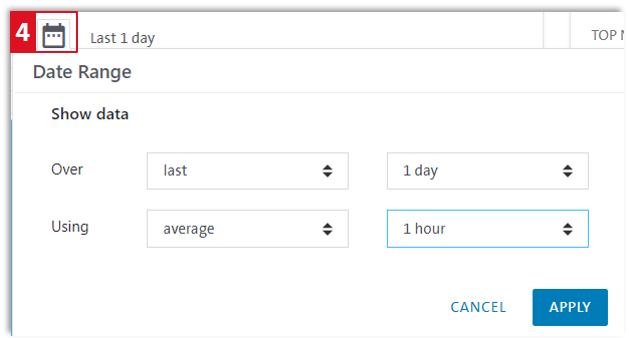
Over
- On the one hand, you have to choose from:
previous last current
- In addition to:
15 / 30 minutes 1 / 6 hours 1 day 1 week 1 / 3 / 6 month 1 year custom (manual number of days, week, months, etc.) calendar (manually defining start and end dates)
Using
-
Under Using you can estimate which value is displayed exactly and is calculated based on the selection from Display.
-
You can choose from:
avarage: Average value min: Lowest measured value max: Highest measured value sum: Works only when exporting to Excel: Counts the number of deviations to the mean. last: Shows the last measurement within the defined time interval (1 hour, 1 day, 1 week) count: Is the number of underlying report nodes (makes little sense with 'graph reports', but all the more so in tables)
-
Note that real-time is a measurement of every 5 minutes.
-
Select the frequency of measurements.
-
You can choose from the following values:
real-time 1 hour 1 day 1 week
-
Maximum storage duration of real-time data and their aggregations:
real-time: 30 days 1h aggregation: 60 day 1 day aggregation: 2 years* *Visibility is limited to 6 months. If more than 6 months are required, please contact onlinecontact.ent@swisscom.com.