Customer Overview / Dashboard
Upon accessing SPR trhough the Enterprise Connect Dashboard, customers are automatically directed to the dashboard. This article explains how to interpret the dashboard, understand the information presented, and navigate its features effectively.
Total Bandwith & Top Network Load
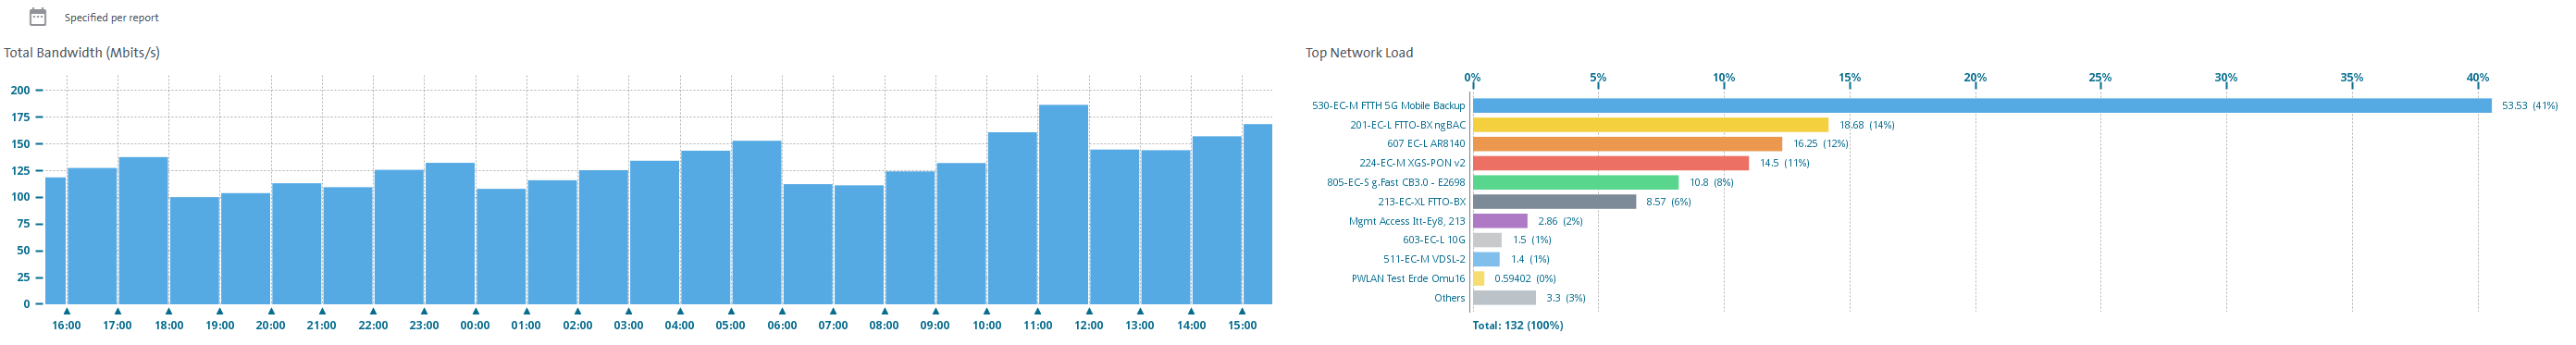
What does it show?
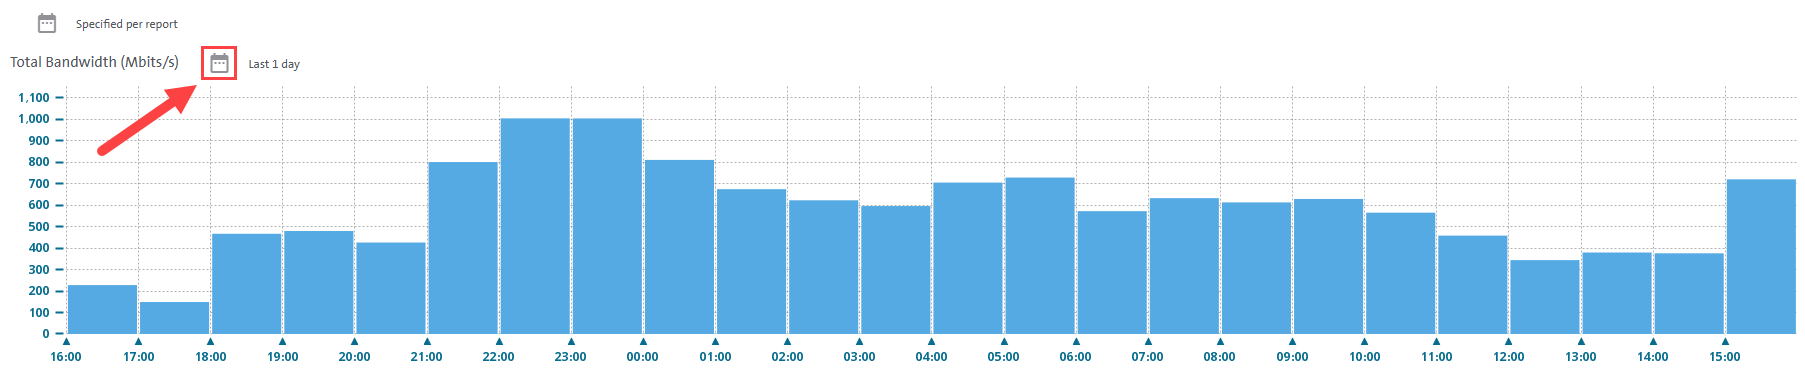
- The Total Bandwith graph shows information on the accumulated traffic of all sites for which SPR is activated
- The Top Network Load graph shows the ten locations that contibute the most to overall network trafic
What actions can I take?
- By default, both graphs display data from the past 24 hours, using one-hour average intervals. You can adjust the display period for the graphs to view data over any custom time range, up to a maximum of two years in the past via the calender icon on the top left of the respective graph. The interval for data aggregation is also user-configurable, with a minimum interval of five minutes. In addition to viewing average values, you can choose to display minimum, maximum, and other statistical values for each interval.
- Customers can download the information available on the graphs through the