Service Peroformance Reporting Overview
Service Performance Reporting (SPR) is an integral feature within Swisscom's suite of Enterprise Connectivity and Network Services. By delivering tailored reports on the health and performance of your data network, it empowers you with crucial technical insights. This foresight allows you to identify and resolve potential bottlenecks early, ensuring that you can fully leverage your network bandwidth whenever needed.
The SPR reports data on individual EC sites, but also for centralized services namely Central Internet and Cloud Access. Please select below the service that you would like to learn more about.
The tool offers consistent methods for adjusting, downloading, and exporting the displayed data in various formats, which are the same across all types of reporting. These methods are explained below.
Modify Graphs, Export Data and Further Actionable Insights
Modify Graphs
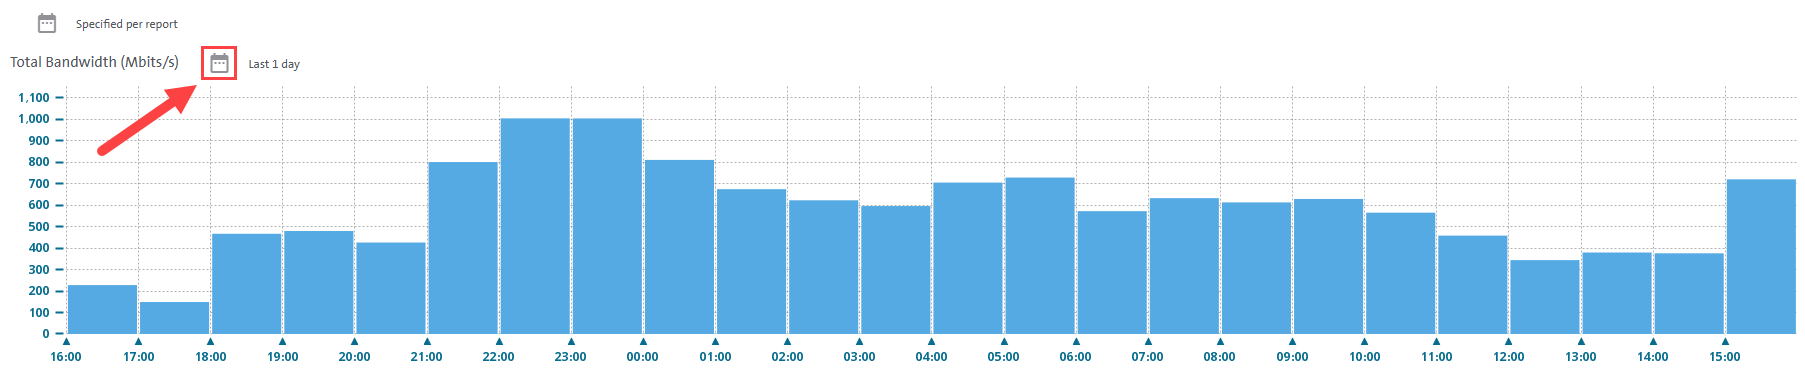
- By default, graphs display data from the past 24 hours, using one-hour average intervals. You can adjust the display period for the graphs to view data over any custom time range, up to a maximum of two years in the past. The interval for data aggregation is also user-configurable, with a minimum interval of five minutes which is referred to in the tool as "real-time". In addition to viewing average values, you can choose to display minimum, maximum, and other statistical values for each interval. These settings can be accessed through the calender icon in the top elft corner of the respective graph.
Export Data
- Customers can download most of the displayed information from graphs as well as tables in different formats namely pdf, excel, csv or xml. To download the displayed data use the icon displayed below.

Further Actionable Insights
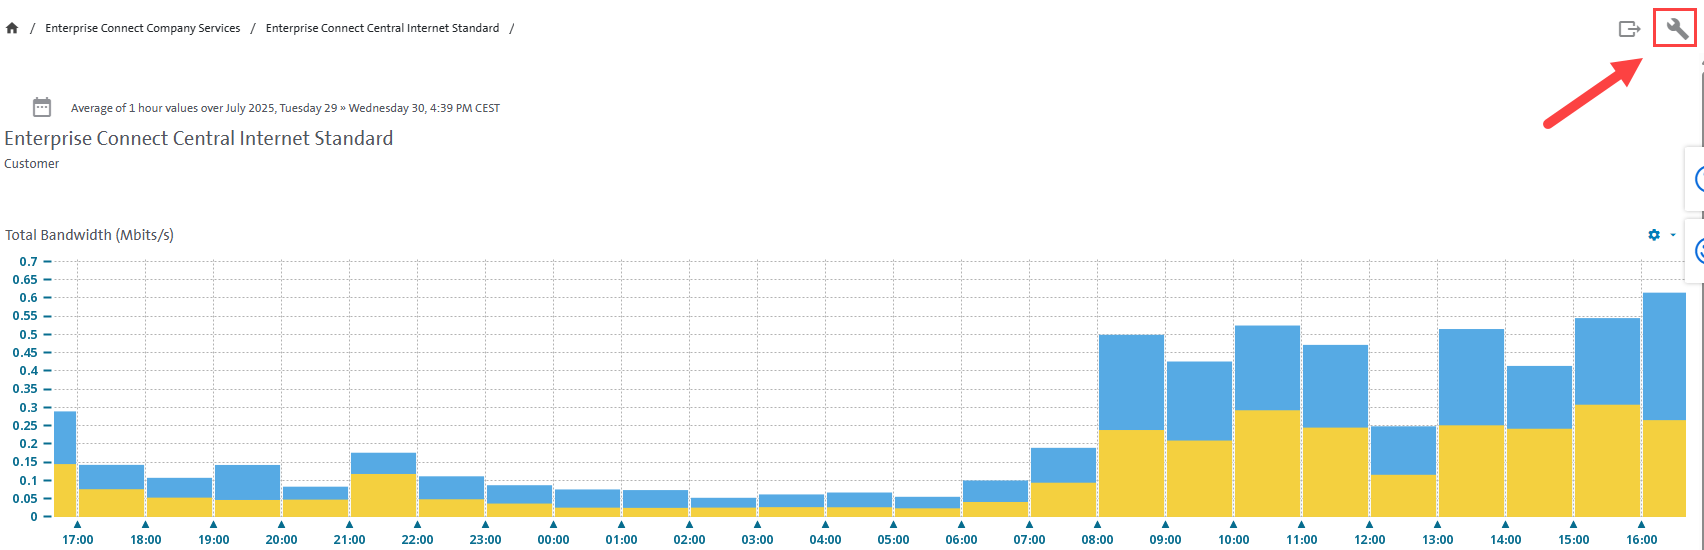
- Additional functions become available through the icon depicted in the grafic below below:
- Schedule a report to be sent via e-mail to you and selected recipients according to a recurring report schedule, allowing you to customize the delivery frequency.
- E-mail a report to the address with which you logged in.
- Create new favorite reports that are used frequently for easier access. Once you set them, you can find all favorite reports in the sidebar on the left under "My Reports" and "Favorite Reports."
Chapters in Service Peroformance Reporting
- Explanations on 'Bandwidth Baseline' / 'Utilization Baseline'
- Explanation on 'Booked Bandwidth in Mbits s' / 'Interface Utilization'
- Create favourite
- Individual settings for 'Total Bandwidth Mbits s' / 'Top Network load'
- Set time period / duration view
- Send report via e-mail
- Create Scheduled Report
- Delete Scheduled Report
- Printing statistic
- Delete stored report
- Traffic Reporting per VPN