Bandwidth Baseline & Utilization Baseline
- This guide provides you explanations on Bandwidth Baseline & Utilization Baseline
- Baseline reports show performance information on a single metric over a 24-hour period.
- The baseline helps you understand whether the current value of the metric is normal or represents a deviation that indicates a problem.
- A baseline report requires more than 1 week of data before it can display the grey line that represents the baseline average.
- If less than 1 week's worth of data is available, only the blue line showing values for the last 24 hours will be displayed in the report.
- A baseline is fully functional when 4 or more weeks of data are available.
- Baselines are particularly useful for interpreting performance metrics.
- The baseline allows you to compare the current value of a metric with the average value over time.
- Any deviation from the average will be visually highlighted to you.
- You can also see trends in performance over time.
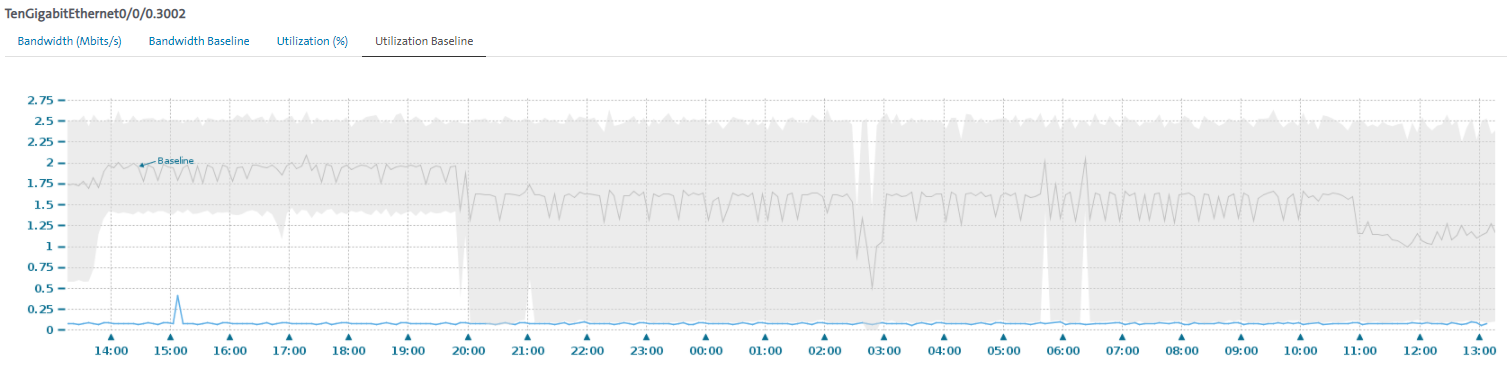
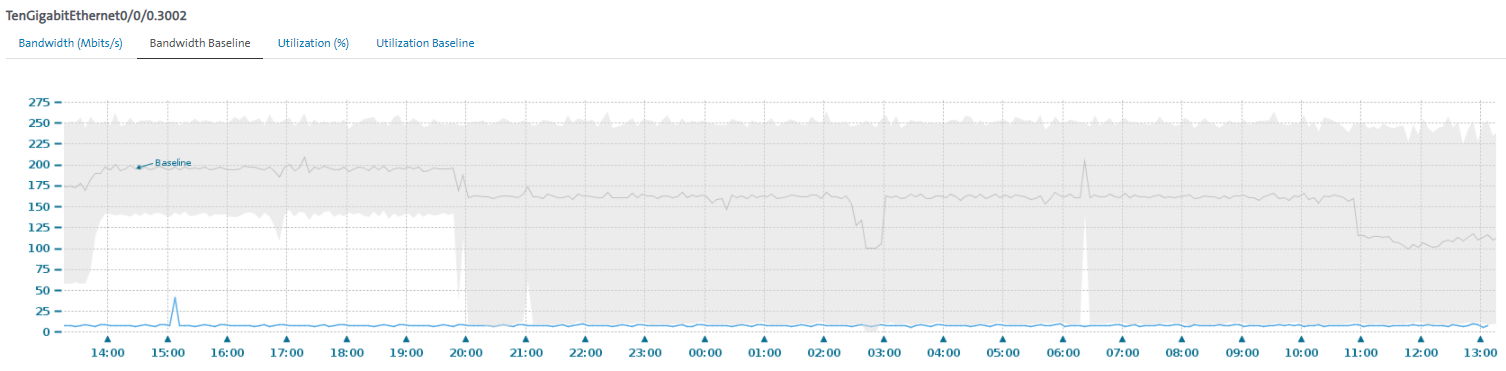
- A baseline report contains the following information:
- Blue line: Shows the value of the metric over the last 24 hours.
- Grey line: Shows the average value of the metric over the last 4 weeks for the same day of the week and hours represented by the blue line.
- Grey shaded area: Shows the range of all values recorded over the last 4 weeks for the same day of the week and the same hours represented by the blue line.