Firewall Logs and Reports
- Under Logs & Reports you have the possibility to activate Logging and Firewall Debug.
- If you enable logging, you have the option to log traffic for a certain amount of time.
- Access these logs can be found in the dashboard under LogView.
- When you turn on Firewall Debug, detailed logs are created (including denied traffic) to help you troubleshoot your network.
- The detailed logs are created and kept for the following 4 hours.
Configuration
-
For Security go to Managed Security > Log & Reports
-
Activate Loggin and/or Firewall Debug, Save the change.
Log view
-
Now under Log View / Type select whether you want to see network traffic (Taffic) logs or Web filter traffic logs.
-
Under Time span select either the predefined time span or Custom and the corresponding date/time.
-
Under Advanced Filter you can select the type of logs you want to see; the selection is based on source IP, destination IP, action, service, protocol.
- You can also enter the desired log selection in the form property=value and property=notThis Value.
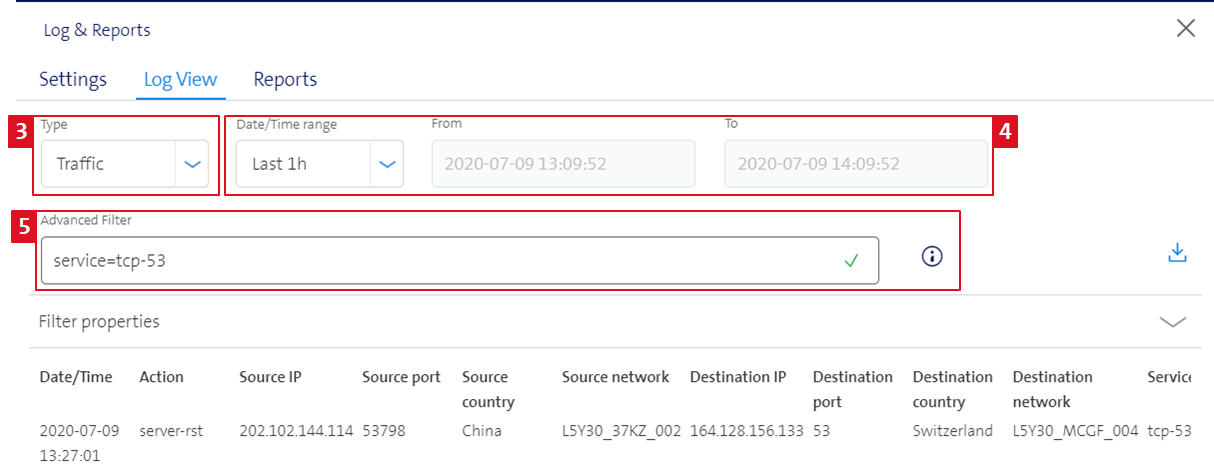
- Finally, you have the option to download the logs by clicking on the blue arrow.
- This downloads the logs to a csv file.

Reports
Below Reports you have the possibility to download reports that provide an overview of the state of your firewall as well as statistics about visited websites, blocked and allowed categories and victims of phishing sites.